You need some finished processings with resets of the PPP solution to create Multi-Plots. Therefore, this page builds up on My first Batch-Processing. It would be best if you did the batch processing explained there but add a reset of the solution, for example, every 60 minutes (Run: Processing Options).
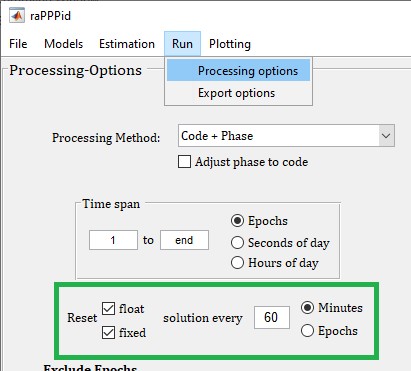
Please note that the GUI might look slightly different depending on your raPPPid version.
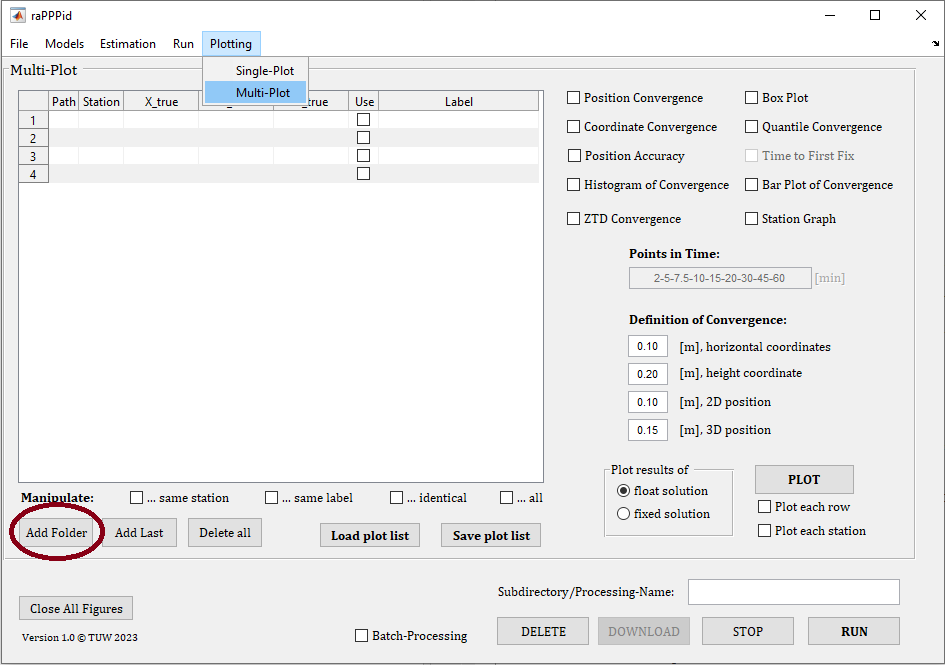
Change to the Multi-Plot panel and add the result folders to the table. In the Multi-Plot table, each row corresponds to one processing. If you select a folder and press OK, raPPPid will look in this folder and all sub-folders for processing results and add them to the Multi-Plot table.
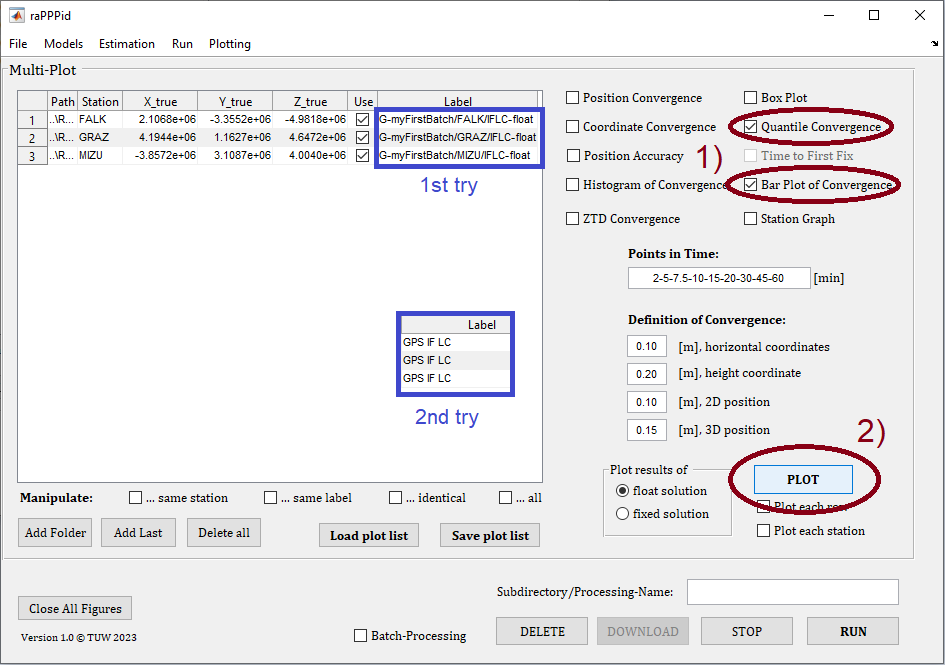
After adding the three processings, your table should look similar to the provided screenshot. Enable some plots in the top right of the panel (1) and then plot with the PLOT button in the bottom right (2). Note that rows/processings with the same label are grouped together, and this label is used to title the plots. So try to change the labels to the examples provided in the screenshot, plot again, and check what happens (e.g., 1st and 2nd try in the provided screenshot). The resulting plots should look similar to the following (make sure that you did the described batch processing with a reset every 60 minutes):
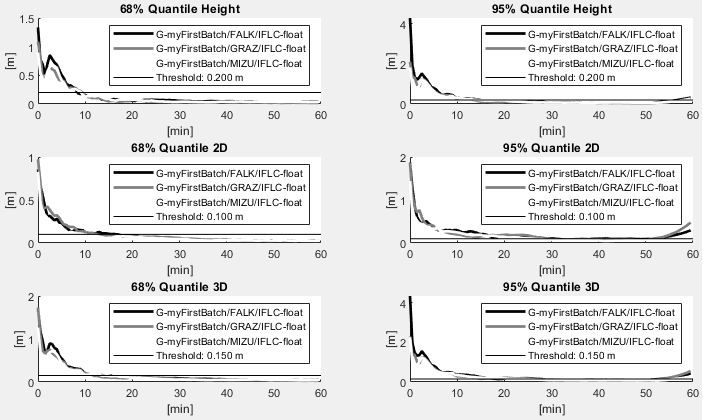
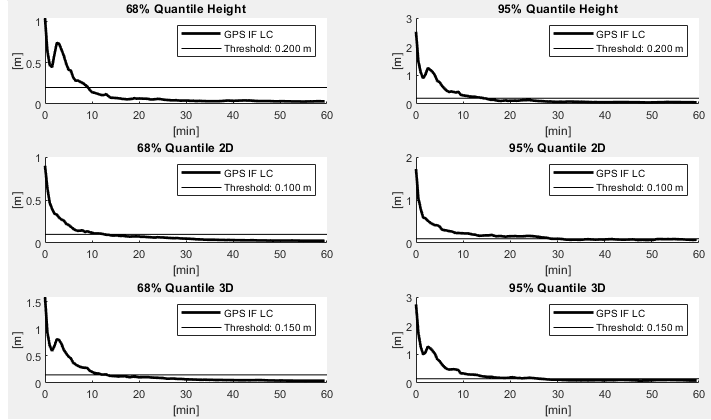
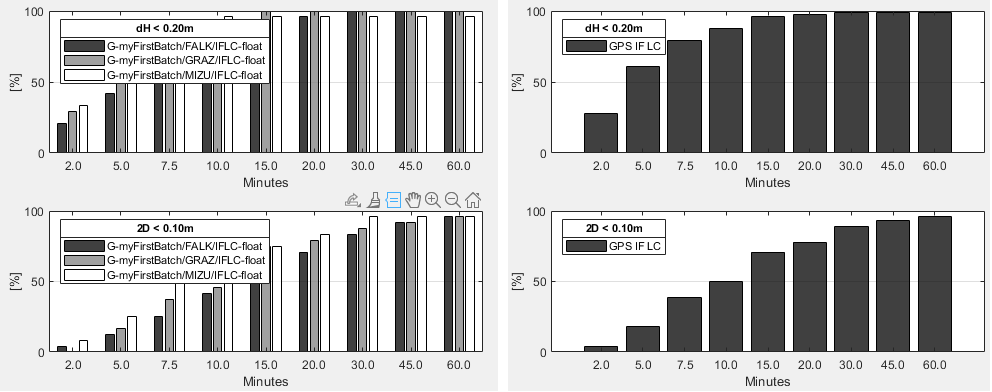
Well done, you have successfully created your first Multi-Plots! You can now compare the coordinate convergence behavior of different processing settings. For example, you can compare the results of different stations which were processed with the same settings (station AAAA converges faster than station BBBB). Or you can compare the same set of stations processed with different processing settings (e.g., different satellite products).
Jump to Table of Content